I've just returned from an interdisciplinary workshop at Indiana University on "putting memory in place." The organizers wanted to explore the ways that memories and places are linked, the forces that lead to individual or social forgetting, and the potential role for technology in resisting these forces. The presentations and discussions were excellent. One of the things that I found most interesting about the workshop was that an interaction design class led by Marty Siegel was given the task of attending the workshop sessions and then presenting a new design to the workshop participants at the end. After listening and sketching for a couple of days, the IxD group described one new environment where memory could be put in place. They imagined an open multistory space that you could move about in, filled with soft music. In different places you could hear voices, stories about the past, whispers at first, one voice becoming stronger as you attuned to it. Their space was also shot through with invisible (or barely perceptible) beams of light. Breaking one of these with your hand, you could see a succession of images or a moving image projected onto it. Remembering in such a space could be quite social, as people oriented toward the stories that one another found compelling. The designers intended the vertical dimension of the system to represent the kind of layers that one finds in geological strata or geographical information systems. They also imagined that the media in the space would be live, updated with a mechanism something like RSS feeds or a mashup website.
While I was at IU, I also had a chance to drop in on a digital history grad class that Kirsten Sword is teaching based on the Clio Wired course developed at CHNM. I'm not teaching this term, so it was fun to get a chance to talk with students who are learning about digital history and excited about it. One of the questions that came up was the degree to which historians and other humanists should develop their own tools, and the degree to which they can depend on software or services created by others. When I visited Kirsten's class, I hadn't yet seen the outcome of the IxD process, but I think it reflects on this question.
One of the fundamental ideas of the design process is to submit what you come up with to a rigorous critique, and the workshop participants were happy to provide this feedback to the IxD class. Some felt that the class design was too cluttered, some that it was too uniform, some that it was too phallic. People were concerned about the psychic effect of projecting disturbing images onto one's own body. The design group took these comments in the constructive spirit in which they were offered. At the end of the session Marty squeezed himself into one corner and said "I often tell my class to imagine the design that we've just talked about is over here in this corner of the room. Now what's in the other corner?"
I think that it's very important to treat the development of technical systems as a form of critical, reflective practice. We make something as a way of understanding it. I'm toying with the idea of adding a studio component to my digital history class next year. My students are comfortable with reading papers and discussing them, and they quickly get comfortable with the practice of blogging. I'm not sure, however, that they think of themselves as makers, and the studio process might be very valuable for them (and for me). We know what's in this corner. What's in the other one?
Tags: digital history | GIS | historical consciousness | immersive environments | interaction design | mashups | memory | pedagogy | place | RSS
Sunday, February 25, 2007
Friday, February 16, 2007
How To: See the Field at a Glance
Sometimes you want to know what's going on in a field that you're doing work in, but don't have much time to keep up with it. Wouldn't it be great to have your own 'situation room' to drop into for a few minutes at irregular intervals? Fortunately, it's quite easy to create a constantly-updated page to monitor any subject that you're interested in.
For example, I like to have a general idea of what is happening in environmental history. Usually this information comes to me by e-mail (e.g., the H-Environment mailing list), in my subscription to the journal Environmental History, by browsing for books and reading book reviews, by talking to colleagues, and so on. When things get busy, I find that I skip or delete e-mail messages and put journals on the shelf unread. It would be better for me to have one 'place' where the information accumulated without my intervention. Here's how to set that up.
First of all, create a (free) account at Netvibes. This service allows you to put together a collection of feeds and other useful modules. It's kind of like a cross between a customizable newspaper and a computer desktop, but one that you can access wherever you can log in to the internet. When you create your account, it will give you a sample page with lots of stuff already on it. You can clear it off by deleting those modules and then start adding new modules.
I decided to lay out my page by putting the stuff that changes most frequently on the left hand side, and by color coding my sources of information: blue for news and discussion, green for announcements, yellow for books, orange for journals. Obviously, you can set this up in whatever way makes sense for you. For news sources, I added RSS feeds for Jan Oosthoek's "Environmental History News" (RSS), recent traffic on the H-Environment mailing list (RSS) and a blog search for "environmental history." That gives me a spectrum of discussion ranging from edited, through mildly moderated to free-for-all. In order to get announcements, we again make use of an H-Net RSS feed, but we only want to see environmental announcements. So we pass the feed through a Feedshake filter. This is a free service that lets you combine and manipulate RSS feeds online. To get the latest book news we grab a feed of reviews from H-Environment (RSS) and create a feed of recent environmental history books at Amazon. We can do this using Paul Bausch's Amazon Feed Generator. We do a search for keywords "environmental history" or "ecological history," limit the results to English language books, and sort them from most recently to least recently published. Next we want to get links to the tables of contents for the journals Environmental History and Environment and History. To do this we make use of the Feed43 service that I described in my last post. Finally, we toss in a notepad module, to jot down anything we want to remember while skimming. The finished page looks like this:

Tags: digital history | new information | RSS
Tuesday, February 13, 2007
How To: Scrape a Web Page to RSS Feed
One thing that I've been arguing since I began this blog is that it is essential for historians to learn how to search, spider and scrape in order to make the best use of online sources. These tasks are relatively easy if you already know how to program. Many historians, of course, don't. I have a semi-regular series on "Easy Pieces in Python," but I know that at least some of my readers think that I'm stretching the truth a bit with 'easy.' I've decided to start another semi-regular "How To" series for hacks that you can do without any programming at all.
I regularly read Tara Calashain's wonderful blog ResearchBuzz, so when David Davisson recommended her new book Information Trapping, I went right out and bought it. It's definitely worth reading ... in fact, I'm thinking of assigning it to my digital history students next year. Without giving away too much of the book, I think it's fair to say that it might have been subtitled "How to do things with RSS feeds." Which is great if you've got feeds. What do you do if not?
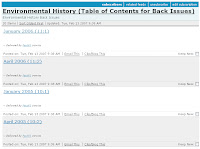
Here's an example. Tables of contents for back issues of the journal Environmental History are stored in an HTML table on a web page at the Forest History Society. Suppose you want to look through them. You could always go to the page and browse. If you do this every few months, you will see that another issue has been added as a new one is released. Calishain discusses the use of page monitors to track these kinds of changes, so that you don't have to try to remember to visit the site on a regular basis.
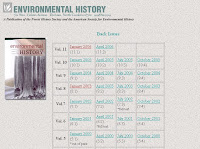
Another strategy is scrape the information off of the webpage, transform it into an RSS feed, and make it available where you are going to be spending an increasing amount of your time (i.e., in your feed reader). You can do this without programming by making use of a sweet new free service called Feed43. Go to the website and choose "Create Your Own Feed." The first thing that it is going to ask you is for an address. Here you enter the URL of the page that you want to scrape:
When you click the button it will load the HTML of the page into a window. Now you need to identify the information you will be scraping from the page. In this case you're going to want the month, volume and issue number, and URL for the page with the table of contents. When you look through the HTML source, you see that an individual entry typically looks like this:
Notice that I've included some of the HTML code that surrounds each entry. This is very important for scraping, because the scraper needs to identify what constitutes an entry on the basis of the surrounding code. You want to choose as much surrounding code as you need to uniquely identify the data you're interested in. Once you have identified your data and the surrounding context, you turn it into a pattern by using '{%}' to match data regions as shown below:
Enter the above into the "Item (repeatable) Search Pattern," and press the "Extract" button. If all went as planned, the scraper should be able to pull out exactly the information that you are interested in. Your clipped data should look like this:
Note that the three {%} patterns above matched the URL, month, and volume and issue number. At this point we have to define the output format for our feed. We can keep the suggested defaults for the feed properties, but we have to set up patterns for our output items. Set the "Item Title Template" to
the "Item Link Template" to
and since we don't have any content, just set that to a non-breaking space. Click "Preview" to make sure that your feed looks OK. At this point you can subscribe to your feed.
Tags: digital history | scraping | RSS
I regularly read Tara Calashain's wonderful blog ResearchBuzz, so when David Davisson recommended her new book Information Trapping, I went right out and bought it. It's definitely worth reading ... in fact, I'm thinking of assigning it to my digital history students next year. Without giving away too much of the book, I think it's fair to say that it might have been subtitled "How to do things with RSS feeds." Which is great if you've got feeds. What do you do if not?
Here's an example. Tables of contents for back issues of the journal Environmental History are stored in an HTML table on a web page at the Forest History Society. Suppose you want to look through them. You could always go to the page and browse. If you do this every few months, you will see that another issue has been added as a new one is released. Calishain discusses the use of page monitors to track these kinds of changes, so that you don't have to try to remember to visit the site on a regular basis.

Another strategy is scrape the information off of the webpage, transform it into an RSS feed, and make it available where you are going to be spending an increasing amount of your time (i.e., in your feed reader). You can do this without programming by making use of a sweet new free service called Feed43. Go to the website and choose "Create Your Own Feed." The first thing that it is going to ask you is for an address. Here you enter the URL of the page that you want to scrape:
http://www.foresthistory.org/Publications/EH/ehback.html
When you click the button it will load the HTML of the page into a window. Now you need to identify the information you will be scraping from the page. In this case you're going to want the month, volume and issue number, and URL for the page with the table of contents. When you look through the HTML source, you see that an individual entry typically looks like this:
<font face="Times New Roman, Times, serif"><a href="http://www.foresthistory.org/Publications/EH/ehjan2006.html">January
2006</a> (11:1) </font>
Notice that I've included some of the HTML code that surrounds each entry. This is very important for scraping, because the scraper needs to identify what constitutes an entry on the basis of the surrounding code. You want to choose as much surrounding code as you need to uniquely identify the data you're interested in. Once you have identified your data and the surrounding context, you turn it into a pattern by using '{%}' to match data regions as shown below:
<font face="Times New Roman, Times, serif"><a href="{%}">{%}</a>{%}</font>
Enter the above into the "Item (repeatable) Search Pattern," and press the "Extract" button. If all went as planned, the scraper should be able to pull out exactly the information that you are interested in. Your clipped data should look like this:
Item 1
{%1} = http://www.foresthistory.org/Publications/EH/ehjan2006.html
{%2} = January 2006
{%3} = (11:1)
Item 2
{%1} = http://www.foresthistory.org/Publications/EH/ehapr2006.html
{%2} = April 2006
{%3} = (11:2)
Note that the three {%} patterns above matched the URL, month, and volume and issue number. At this point we have to define the output format for our feed. We can keep the suggested defaults for the feed properties, but we have to set up patterns for our output items. Set the "Item Title Template" to
{%2} {%3}
the "Item Link Template" to
{%1}
and since we don't have any content, just set that to a non-breaking space. Click "Preview" to make sure that your feed looks OK. At this point you can subscribe to your feed.

Tags: digital history | scraping | RSS
Sunday, February 11, 2007
Easy Pieces in Python: Munging
Often you find yourself with a file of data in one format, and you'd really like to have it in a different format. In this situation, writing short, one-off scripts is sometimes known as munging. It's the kind of thing that Python is really good for.
Yesterday I posted a list of digital history courses in two formats, as an Excel spreadsheet, and as a CSV (comma separated values) file. The spreadsheet format is proprietary, and more-or-less useless unless you want to manipulate your data in Excel. The CSV file is more promising. It is a simple text file with one data record on each line, the fields separated by commas. But if we had the same data in an RSS file, it would be even more useful, because we could pop it into a feed reader, or use it for some devious hack in the brand new Yahoo! Pipes.
Besides a header line that we will have to get rid of, the CSV file is flat. That is to say that there is one record per row but no other structure. RSS files consist of nested elements: the whole thing is an RSS block, containing one channel, which has a header followed by a series of items. So when we are building our RSS file, we want to create the header, loop through our CSV records to create the items, then finish with a footer. In fact, munging tasks often have three parts: do something to get ready, process the file(s) a line at a time, do something to finish up.
We start by opening our CSV file and discarding the header line:
Next we open our RSS file and write the header:
Then we use a loop to parse each line of the CSV file and write a corresponding item for the RSS file:
Finally, we write the RSS file footer and close our two files:
That's all there is to it. Most of the hassle is in getting the tabbing and newlines right, and dealing with the odd missing bit of information (in this case, some of the courses don't seem to have numbers.) The RSS file that we created is here. Now you can easily add it to a feed reader like Bloglines, as shown below.

Tags: hacking | munging | Python | RSS | XML
Yesterday I posted a list of digital history courses in two formats, as an Excel spreadsheet, and as a CSV (comma separated values) file. The spreadsheet format is proprietary, and more-or-less useless unless you want to manipulate your data in Excel. The CSV file is more promising. It is a simple text file with one data record on each line, the fields separated by commas. But if we had the same data in an RSS file, it would be even more useful, because we could pop it into a feed reader, or use it for some devious hack in the brand new Yahoo! Pipes.
Besides a header line that we will have to get rid of, the CSV file is flat. That is to say that there is one record per row but no other structure. RSS files consist of nested elements: the whole thing is an RSS block, containing one channel, which has a header followed by a series of items. So when we are building our RSS file, we want to create the header, loop through our CSV records to create the items, then finish with a footer. In fact, munging tasks often have three parts: do something to get ready, process the file(s) a line at a time, do something to finish up.
We start by opening our CSV file and discarding the header line:
datafile = open('digital_history_courses_20070210.csv', 'r')
datafile.readline()
Next we open our RSS file and write the header:
feedfile = open('digital_history_courses_20070210.xml', 'w')
feedfile.write('<?xml version="1.0"?>\n')
feedfile.write('<rss version="2.0">\n')
feedfile.write('\t<channel>\n')
feedfile.write('\t\t<title>Digital History Courses</title>\n')
feedfile.write('\t\t<link>http://digitalhistory.uwo.ca/dhh/hacks/digital_history_courses_20070210.csv</link>\n')
feedfile.write('\t\t<description>Example of munging CSV to RSS 2.0</description>\n')
Then we use a loop to parse each line of the CSV file and write a corresponding item for the RSS file:
for line in datafile.readlines():
    items = line.split(',')
    school = items[0]
    course = items[1]
    if course == '': course = 'N/A'
    title = items[2]
    instructor = items[3]
    year = items[4]
    url = items[5]
    feedfile.write('\t\t<item>\n')
    feedfile.write('\t\t\t<title>' + title + '</title>\n')
    feedfile.write('\t\t\t<link>'+ url.rstrip('\n') + '</link>\n')
    feedfile.write('\t\t\t<description>\n')
    feedfile.write('\t\t\t' + course + ', ' + instructor + ', ')
    feedfile.write(school + ', ' + year + '\n')
    feedfile.write('\t\t\t</description>\n')
    feedfile.write('\t\t</item>\n')
Finally, we write the RSS file footer and close our two files:
feedfile.write('\t</channel>\n')
feedfile.write('</rss>\n')
datafile.close()
feedfile.close()
That's all there is to it. Most of the hassle is in getting the tabbing and newlines right, and dealing with the odd missing bit of information (in this case, some of the courses don't seem to have numbers.) The RSS file that we created is here. Now you can easily add it to a feed reader like Bloglines, as shown below.

Tags: hacking | munging | Python | RSS | XML
Saturday, February 10, 2007
Syllabi for Digital History Classes
It looks like I will be teaching my grad class in digital history again this fall and may have the opportunity to expand it to a full year course. So I've put together a brief list of syllabi for about 65 other courses that are similar or might serve as inspiration (available here in CSV and MS Excel formats). At this point the list is idiosyncratic and very partial because I'm planning to use it for some future hacks. Nevertheless, I'd be happy to hear from anyone who wants to suggest additions.
Tags: digital history | pedagogy | syllabus
Tags: digital history | pedagogy | syllabus
Sunday, February 04, 2007
Exploratory Bibliography 3: Temporal Strata in Recommendations
We've been using the digital history reading list as the basis for a series of hacks that make use of some of the features of the Amazon API to explore the conceptual space around a sample bibliography. In the first post in the series, we spidered customer recommendations to find other books that might be of interest. In the second post, we visualized the network of recommendations using the freely-available Graphviz package. One of the things that we noticed was that there was a tight cluster of digital humanities 'classics' published between 1991 and 2002, bound together by recommendations but not linked into the larger network. This suggested that we might find temporal strata in recommendations ... that is, that books of a particular era might be linked to one another by customer recommendations, but not linked to books published much earlier or later.
Today we will explore that hypothesis a bit further. We don't have nearly enough data to make any claims about customer recommendations in general, but this is supposed to be exploratory hacking. We're looking for phenomena that might be of interest, for studies we might want to undertake later on large data sets.
As every programmer knows, most of the trick to solving a problem algorithmically is to represent the data in a way that makes the answer easy to find. At the conclusion of our last hack, we had a long list of Amazon Standard ID Number (ASIN) pairs representing recommendations: "if you liked that, you'll like this." Now what we need to do is to submit each ASIN to the Amazon API and get the publication date. Then we will have a long list of date pairs: "if you liked that book published in year x, you'll like this book published in year y." We then transform those pairs into a matrix. Some quick-and-dirty Python source to do most of the work is here.

Now, for any given year that books on our list were published, we can see how many recommendations were for books published earlier, how many for books published the same year, and how many for books published later. If you look at the figure above, I've put boxes around the diagonal which represents the case where both books were published the same year. Everything to the left of that boxed cell is a recommendation that was published earlier; everything to the right is a recommendation that was published later.
Without too much generalization, we can say that it appears that the recommendations for books published earlier tend to be more spread out in time than the ones for those published more recently. This may reflect the fact that those books have had more time to take their place in the literature, or it may be due to the fact that Amazon hasn't been collecting data for very long and has been growing during that time, or to some other factor(s).
We want to be a bit careful about comparing different rows in the matrix, because most of the books that are on the digital history reading list were published relatively recently (many in 2006). So we can't look at the blob of color in the lower right hand corner, for example, and conclude that most recommendations are to recent books. Instead what we have to do is normalize our data by determining what proportion of recommended books were published earlier, the same year as, and later than a given year. That is shown in the figure below.

It appears that recommendations for earlier books tend to be to those published later, and recommendations for later books tend to be to those published earlier. And finally, it appears that a growing proportion of recommendations are to books published the same year. The fact that the year 2001 seems to be an exception to this trend may be worth investigating.
Tags: Amazon | application program interface | bibliography | hacking | python | visualization
Thursday, February 01, 2007
More Readings for a Field in Digital History
Last month I posted a draft reading list for a general / comprehensive graduate exam in digital history. The list raised a fair amount of interest, and a number of people were kind enough to e-mail me suggested additions or blog about them. So, more or less in the order that I received them, here are more readings for a field in digital history. As before, I've included links to Amazon records to support further hacking. Suggestions are still welcome, of course.
John Jordan emphasized the historical precursors of digital history, particularly systems theory.
Tags: bibliography | digital history | history education | pedagogy
John Jordan emphasized the historical precursors of digital history, particularly systems theory.
- Ackoff, Russell and Fred Emery. On Purposeful Systems: An Interdisciplinary Analysis of Individual and Social Behavior as a System of Purposeful Events, new ed. Aldine, 2005.
- Bowker, Geoffrey C., Susan Leigh Star, William Turner and Les Gasser, eds. Social Science, Technical Systems, and Cooperative Work: Beyond the Great Divide. Lawrence Erlbaum Associates, 1997.
- Churchman, C. West. The Systems Approach, rev. ed. Dell, 1984.
- Copeland, B. Jack, ed. The Essential Turing. Oxford, 2004.
- Emery, Fred E., ed. Systems Thinking. Penguin, 1981.
- Emery, Fred E. and Eric L. Trist. Towards a Social Ecology. Springer, 1975.
- Hodges, Andrew. Alan Turing: The Enigma. Walker and Company, 2000.
- Rogers, Everett M. Diffusion of Innovations, 5th ed. Free Press, 2003.
- Russell, Stuart J. and Peter Norvig. Artificial Intelligence: A Modern Approach, 2nd ed. Prentice Hall, 2002.
- Simon, Herbert A. Sciences of the Artificial, 3rd ed. MIT, 1996.
- Simon, Herbert A. Administrative Behavior, 4th ed. Free Press, 1997.
- Tufte, Edward R. The Visual Display of Quantitative Information, 2nd ed. Graphics Press, 2001.
- Bogost, Ian. Unit Operations: An Approach to Videogame Criticism. MIT, 2006.
- Derrida, Jacques. Archive Fever: A Freudian Impression. Chicago, 1998.
- Derrida, Jacques. Paper Machine. Stanford, 2005.
- Hayles, N. Katherine. My Mother Was a Computer: Digital Subjects and Literary Texts. Chicago, 2005.
- Heidegger, Martin. The Question Concerning Technology, and Other Essays. Harper, 1982.
- Burton, Orville Vernon, ed. Computing in the Social Sciences and Humanities. Illinois, 2002.
- Landow, George P. Hypertext 3.0: Critical Theory and New Media in an Era of Globalization. Johns Hopkins, 2006.
- Bickner, Carrie. Web Design on a Shoestring. New Riders, 2003.
- Clarke, Andy. Transcending CSS: The Fine Art of Web Design. New Riders, 2006.
- Curtis, Hillman. MTIV: Process, Inspiration, and Practice for the New Media Designer. New Riders, 2002.
- Krug, Steve. Don't Make Me Think: A Commonsense Approach to Web Usability, 2nd ed. New Riders, 2005.
- Lenker, John. Train of Thoughts: Designing the Effective Web Experience. New Riders, 2002.
- Lupton, Ellen. Thinking with Type: A Critical Guide for Designers, Writers, Editors and Students. Princeton Architectural Press, 2004.
- McCloud, Scott. Understanding Comics: The Invisible Art. Harper, 1994. [added by Paula Petrik]
- McCloud, Scott. Reinventing Comics: How Imagination and Technology are Revolutionizing an Art Form. Harper, 2000. [added by Josh]
- Tufte, Edward R. Beautiful Evidence. Graphics Press, 2006.
- Wroblewski, Luke. Site-Seeing: A Visual Approach to Web Usability. Wiley, 2002.
- Zeldman, Jeffrey. Designing with Web Standards, 2nd ed. Peachpit, 2006.
Tags: bibliography | digital history | history education | pedagogy
Subscribe to:
Posts (Atom)